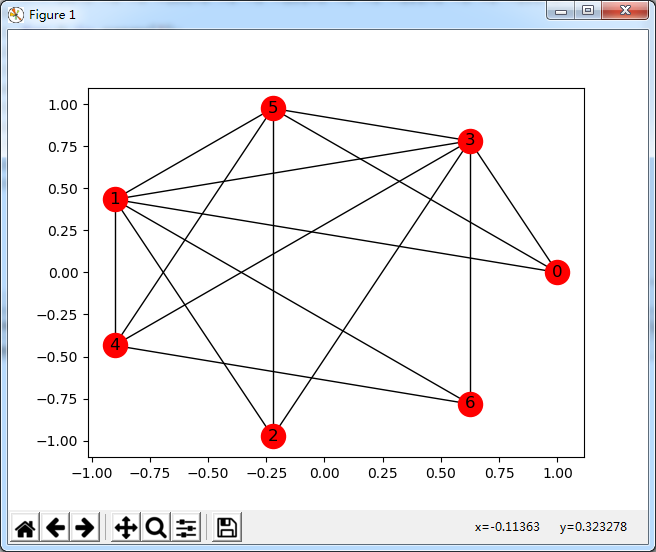
本文实例讲述了Python根据已知邻接矩阵绘制无向图操作。分享给大家供大家参考,具体如下:
有六个点:[0,1,2,3,4,5,6],六个点之间的邻接矩阵如表格所示,根据邻接矩阵绘制出相对应的图
|
|
0 |
1 |
2 |
3 |
4 |
5 |
6 |
|
0 |
0 |
1 |
0 |
1 |
0 |
1 |
0 |
|
1 |
1 |
0 |
1 |
1 |
1 |
1 |
1 |
|
2 |
0 |
1 |
0 |
1 |
0 |
1 |
0 |
|
3 |
1 |
1 |
1 |
0 |
1 |
1 |
1 |
|
4 |
0 |
1 |
0 |
1 |
1 |
1 |
1 |
|
5 |
1 |
1 |
1 |
1 |
1 |
0 |
0 |
|
6 |
0 |
1 |
0 |
1 |
1 |
0 |
0 |
将点之间的联系构造成如下矩阵
N = [[0, 3, 5, 1],
[1, 5, 4, 3],
[2, 1, 3, 5],
[3, 5, 1, 4],
[4, 5, 1, 3],
[5, 3, 4, 1],
[6, 3, 1, 4]]
代码如下
|
1
2
3
4
5
6
7
8
9
10
11
12
13
14
15
16
17
18
|
# -*- coding:utf-8 -*-#! python3import networkx as nximport matplotlib.pyplot as pltG=nx.Graph()point=[0,1,2,3,4,5,6]G.add_nodes_from(point)edglist=[]N = [[0, 3, 5, 1],[1, 5, 4, 3],[2, 1, 3, 5],[3, 5, 1, 4],[4, 5, 1, 3],[5, 3, 4, 1],[6, 3, 1, 4]]for i in range(7): for j in range(1,4): edglist.append((N[i][0],N[i][j]))G=nx.Graph(edglist)position = nx.circular_layout(G)nx.draw_networkx_nodes(G,position, nodelist=point, node_color="r")nx.draw_networkx_edges(G,position)nx.draw_networkx_labels(G,position)plt.show() |
显示结果:

希望本文所述对大家Python程序设计有所帮助。
原文链接:https://blog.csdn.net/weixin_40198632/article/details/78418714


