本文实例为大家分享了pytorch使用Variable实现线性回归的具体代码,供大家参考,具体内容如下
一、手动计算梯度实现线性回归
|
1
2
3
4
5
6
7
8
9
10
11
12
13
14
15
16
17
18
19
20
21
22
23
24
25
26
27
28
29
30
31
32
33
34
35
36
37
38
39
40
41
42
43
44
45
46
47
48
49
50
51
52
53
54
55
56
|
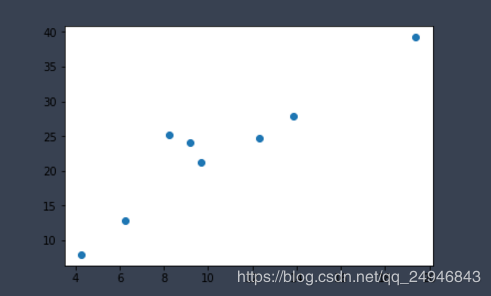
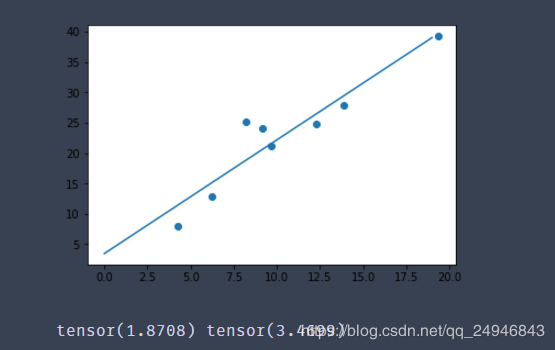
#导入相关包import torch as timport matplotlib.pyplot as plt #构造数据def get_fake_data(batch_size = 8): #设置随机种子数,这样每次生成的随机数都是一样的 t.manual_seed(10) #产生随机数据:y = 2*x+3,加上了一些噪声 x = t.rand(batch_size,1) * 20 #randn生成期望为0方差为1的正态分布随机数 y = x * 2 + (1 + t.randn(batch_size,1)) * 3 return x,y #查看生成数据的分布x,y = get_fake_data()plt.scatter(x.squeeze().numpy(),y.squeeze().numpy()) #线性回归 #随机初始化参数w = t.rand(1,1)b = t.zeros(1,1)#学习率lr = 0.001 for i in range(10000): x,y = get_fake_data() #forward:计算loss y_pred = x.mm(w) + b.expand_as(y) #均方误差作为损失函数 loss = 0.5 * (y_pred - y)**2 loss = loss.sum() #backward:手动计算梯度 dloss = 1 dy_pred = dloss * (y_pred - y) dw = x.t().mm(dy_pred) db = dy_pred.sum() #更新参数 w.sub_(lr * dw) b.sub_(lr * db) if i%1000 == 0: #画图 plt.scatter(x.squeeze().numpy(),y.squeeze().numpy()) x1 = t.arange(0,20).float().view(-1,1) y1 = x1.mm(w) + b.expand_as(x1) plt.plot(x1.numpy(),y1.numpy()) #predicted plt.show() #plt.pause(0.5) print(w.squeeze(),b.squeeze()) |

显示的最后一张图如下所示:

二、自动梯度 计算梯度实现线性回归
|
1
2
3
4
5
6
7
8
9
10
11
12
13
14
15
16
17
18
19
20
21
22
23
24
25
26
27
28
29
30
31
32
33
34
35
36
37
38
39
40
41
42
43
44
45
46
47
48
49
50
|
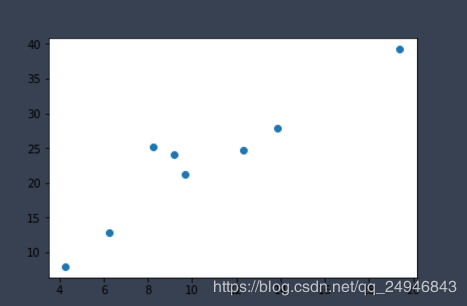
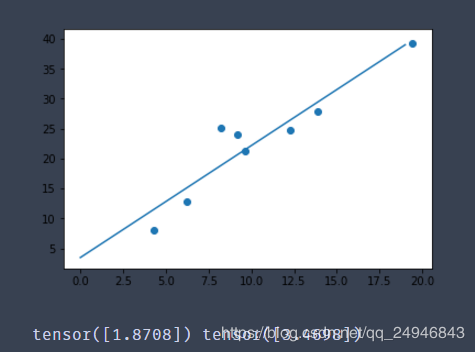
#导入相关包import torch as tfrom torch.autograd import Variable as Vimport matplotlib.pyplot as plt #构造数据def get_fake_data(batch_size=8): t.manual_seed(10) #设置随机数种子 x = t.rand(batch_size,1) * 20 y = 2 * x +(1 + t.randn(batch_size,1)) * 3 return x,y #查看产生的x,y的分布是什么样的x,y = get_fake_data()plt.scatter(x.squeeze().numpy(),y.squeeze().numpy()) #线性回归 #初始化随机参数w = V(t.rand(1,1),requires_grad=True)b = V(t.rand(1,1),requires_grad=True)lr = 0.001for i in range(8000): x,y = get_fake_data() x,y = V(x),V(y) y_pred = x * w + b loss = 0.5 * (y_pred-y)**2 loss = loss.sum() #自动计算梯度 loss.backward() #更新参数 w.data.sub_(lr * w.grad.data) b.data.sub_(lr * b.grad.data) #梯度清零,不清零梯度会累加的 w.grad.data.zero_() b.grad.data.zero_() if i%1000==0: #predicted x = t.arange(0,20).float().view(-1,1) y = x.mm(w.data) + b.data.expand_as(x) plt.plot(x.numpy(),y.numpy()) #true data x2,y2 = get_fake_data() plt.scatter(x2.numpy(),y2.numpy()) plt.show()print(w.data[0],b.data[0]) |

显示的最后一张图如下所示:

用autograd实现的线性回归最大的不同点就在于利用autograd不需要手动计算梯度,可以自动微分。这一点不单是在深度在学习中,在许多机器学习的问题中都很有用。另外,需要注意的是每次反向传播之前要记得先把梯度清零,因为autograd求得的梯度是自动累加的。
以上就是本文的全部内容,希望对大家的学习有所帮助,也希望大家多多支持服务器之家。
原文链接:https://blog.csdn.net/qq_24946843/article/details/89364842


