在prometheus需要向ngxin中打入探针,通过探针获取ngxin信息,并通过接口输出。下文将讲述如何监控ngxin。
1.下载
为了各位小伙伴方便,这里提供了一波下载地址,如果模板不是特别满意,也可以去官网自行下载。
nginx:
链接: https://pan.baidu.com/s/1QxcWrxAEARlEhxSb2ZETjQ
提取码: 6fp5
nginx-module-vts-master:
链接: https://pan.baidu.com/s/1gCyAithAlRkORuZwhpcPmA
提取码: h9aa
nginx-vts-exporter
链接: https://pan.baidu.com/s/1gVB_I6ifDbeNIBX5x9pGAA
提取码: upkw
nginx-vts-stats_rev2 (grafana显示模板)
链接: https://pan.baidu.com/s/1VI9V395OemPkf6W-sNL9HQ
提取码: da56
2.安装nginx与nginx-vts-exporter
1.解压nginx-vts-exporter
这里nginx是重新安装 ,解压nginx-vts-exporter 这里放在usr/local。
unzip nginx-module-vts-master.zip
这里注意nginx版本有要求否则会报错,以下是nginx对应的版本。

2.解压nginx。
tar -zxvf nginx-1.14.2.tar.gz
3.安装
把nginx-vts-exporter放到nginx路径 ,并执行安装操作。
cd usr/local/nginx-1.14.2
./configure --prefix=/usr/local/nginx --add-module=usr/local/nginx-module-vts-master/
注意:注意prefix=/usr/local/nginx意思是安装位置为/usr/local/nginx文件夹
make install
4.修改conf文件
http {
    vhost_traffic_status_zone;
    vhost_traffic_status_filter_by_host on;

...

server {

    ...

    location /status {
        vhost_traffic_status_display;
        vhost_traffic_status_display_format html;
    }
}
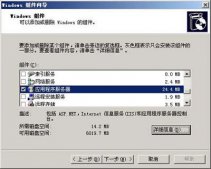
5.启动
cd /usr/local/nginx/sbin
./nginx

访问http://ip/status出现以下显示则表示nginx与nginx-vts-exporter安装成功。
3.安装nginx-vts-exporter-0.9.1.linux-amd64.tar
这里安装包放在usr/local下,解压。
tar -zxvf nginx-vts-exporter-0.9.1.linux-amd64.tar
启动。
cd /usr/local/nginx-vts-exporter-0.9.1.linux-amd64
nohup ./nginx-vts-exporter  -nginx.scrape_uri http://ip/status/format/json &
输入http://ip:9913/metrics,如果出现以下证明完成。

4.配置Prometheus
修改/usr/local/prometheus-2.17.1.linux-amd64/prometheus.yml。
# my global config
global:
  scrape_interval:     15s # Set the scrape interval to every 15 seconds. Default is every 1 minute.
  evaluation_interval: 15s # Evaluate rules every 15 seconds. The default is every 1 minute.
  # scrape_timeout is set to the global default (10s).

# Alertmanager configuration
alerting:
  alertmanagers:
  - static_configs:
    - targets:
      # - alertmanager:9093

# Load rules once and periodically evaluate them according to the global "evaluation_interval".
rule_files:
  # - "first_rules.yml"
  # - "second_rules.yml"

# A scrape configuration containing exactly one endpoint to scrape:
# Here it"s Prometheus itself.
scrape_configs:
  # The job name is added as a label `job=<job_name>` to any timeseries scraped from this config.
  - job_name: "prometheus"
    static_configs:
    - targets: ["localhost:9090"]
  - job_name: "nginx"
    static_configs:
      - targets: ["ip:9913"]
出现以下配置成功。

5.配置Grafana
输入grafana可视化页面地址:ip:3000。
1.配置数据源 (prometheus地址:ip:9090)


上图填写你prometheus地址,端口切记填写9090,点击save后,如果失败会有提示 。
2.可视化界面模板

选择上文配置好的数据源,prometheus选项就是上文配置的数据源。

3.验证
出现以下显示则表示成功。

到此这篇关于解析prometheus+grafana监控nginx的方法的文章就介绍到这了,更多相关prometheus+grafana监控nginx内容请搜索服务器之家以前的文章或继续浏览下面的相关文章希望大家以后多多支持服务器之家!
原文链接:https://blog.csdn.net/qq_20143059/article/details/121138700

")


")